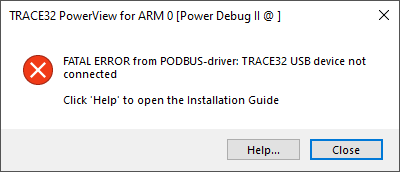
This error message indicates that TRACE32 PowerView is unable to establish a USB connection with the TRACE32 PowerDebug device.

Troubleshooting Steps
1. Verify Power and Connections:
Ensure the PowerDebug device is powered on and properly connected to the PC. A faulty or incorrect power supply can also trigger this error.
2. Check Device Detection by the Operating System:
Windows:
Confirm that the device appears under “TRACE32 Devices” in the Device Manager.
If you do not see any “TRACE32 Devices,” check whether Windows shows an “unknown” USB device that appears/disappears when you connect/disconnect the PowerDebug via USB cable. If such an “unknown” USB device is present, this usually means Windows does not have the correct driver for the PowerDebug device. If no “unknown” USB device appears/disappears, this suggests either the USB cable is damaged. To cross‑check, connect the PowerDebug device to a different PC using a different USB cable. If Windows still does not display any “TRACE32 Device” or “unknown USB Device,” this indicates the PowerDebug USB port may be defective.
Linux:
Run lsusb and check for an entry corresponding to the TRACE32 PowerDebug device. Alternatively, run dmesg | grep -i usb immediately after plugging in the device to see if the kernel logs detect it. On some distributions, you can also check /dev for the corresponding USB device node.
3. Avoid USB Hubs:
Connect the PowerDebug device directly to a USB port on the PC rather than through a hub.
4. Multiple Devices Connected:
If more than one PowerDebug device is attached via USB, you must specify the node name in the TRACE32 configuration file. Example:
; Connection to Host
PBI= USB
NODE=<serialnumber of debugger or device name>
By default, the device name is the serial number of the debug module.
5. Allow Sufficient Reset Time After Power Cycle:
USB connection issues can also occur if you attempt to reconnect too quickly after powering off. Wait at least 10 seconds before powering on again to ensure the debugger is fully reset. If a PowerTrace Serial module is connected, extend this waiting time to 20 seconds. Shorter pauses (e.g., only 1 second) may lead to problems, especially with certain targets.
After powering on, verify that the Select LED is blinking. If the LED remains permanently on, the debugger may not have initialized correctly.
If the above information does not resolve the issue, please contact technical support. Include a detailed description of the problem along with the serial number of the debug module.

Comments (6)
Hello,
Is this the first time you're connecting this debugger to this PC?
For troubleshooting, if possible:
1. Try changing the USB cable.
2. Replace the power supply.
3. Test on a different PC.
If you have a working setup, swapping only the debugger can help confirm whether the issue lies with the debugger or not.
Please let me know the results of these tests.
After testing, if you find that the debugger is defective, you can send it for repair.
Please refer to this article for more details:
https://support.lauterbach.com/kb/articles/sending-defective-hardware-for-repair
If there are any updates or additional findings, please let me know.
Best Regards,
Wafi
Hello,
To avoid confusion, even with a working setup, replacing only the debugger and encountering this issue does not always mean that the debugger is defective. This could also be caused by a misconfiguration in the config file.
However, based on your description, it seems likely that you need to send the debugger to repair. Please proceed accordingly.
Best Regards
Wafi
Hello Rina,
In this case, I suggest opening a new support ticket and providing detailed information about the problem:
https://support.lauterbach.com/new-ticket
Problem Description:
What is causing the issue?
Is this the first time you are attempting to connect the debugger?
System Information:
What versions of the software and hardware are you working with?
Providing this information should help us resolve your problem more effectively.
Best Regards
Wafi