


Getting Started with TRACE32 in CLion
This guide explains how to configure JetBrains CLion to use TRACE32 as the debugger through the TRACE32 Debug Adapter (DAP).
Once configured, you can start, stop, step through code, inspect variables, and debug your target directly from within CLion while TRACE32 handles all communication with the target hardware.
Prerequisites
Before you begin, make sure you have the following installed:
JetBrains CLion with Debug Adapter Protocol (DAP) support (minimum version 2026.1)
TRACE32 PowerView, minimum build number 192017 or Release 09.2026
TRACE32 Debug Adapter (
t32debugadapter) (min: version 0.0.30)A working TRACE32 configuration for your target
An application built with debug information
It is recommended to verify that TRACE32 can connect to your target before configuring CLion.
Step 1 – Configure the TRACE32 Debug Adapter
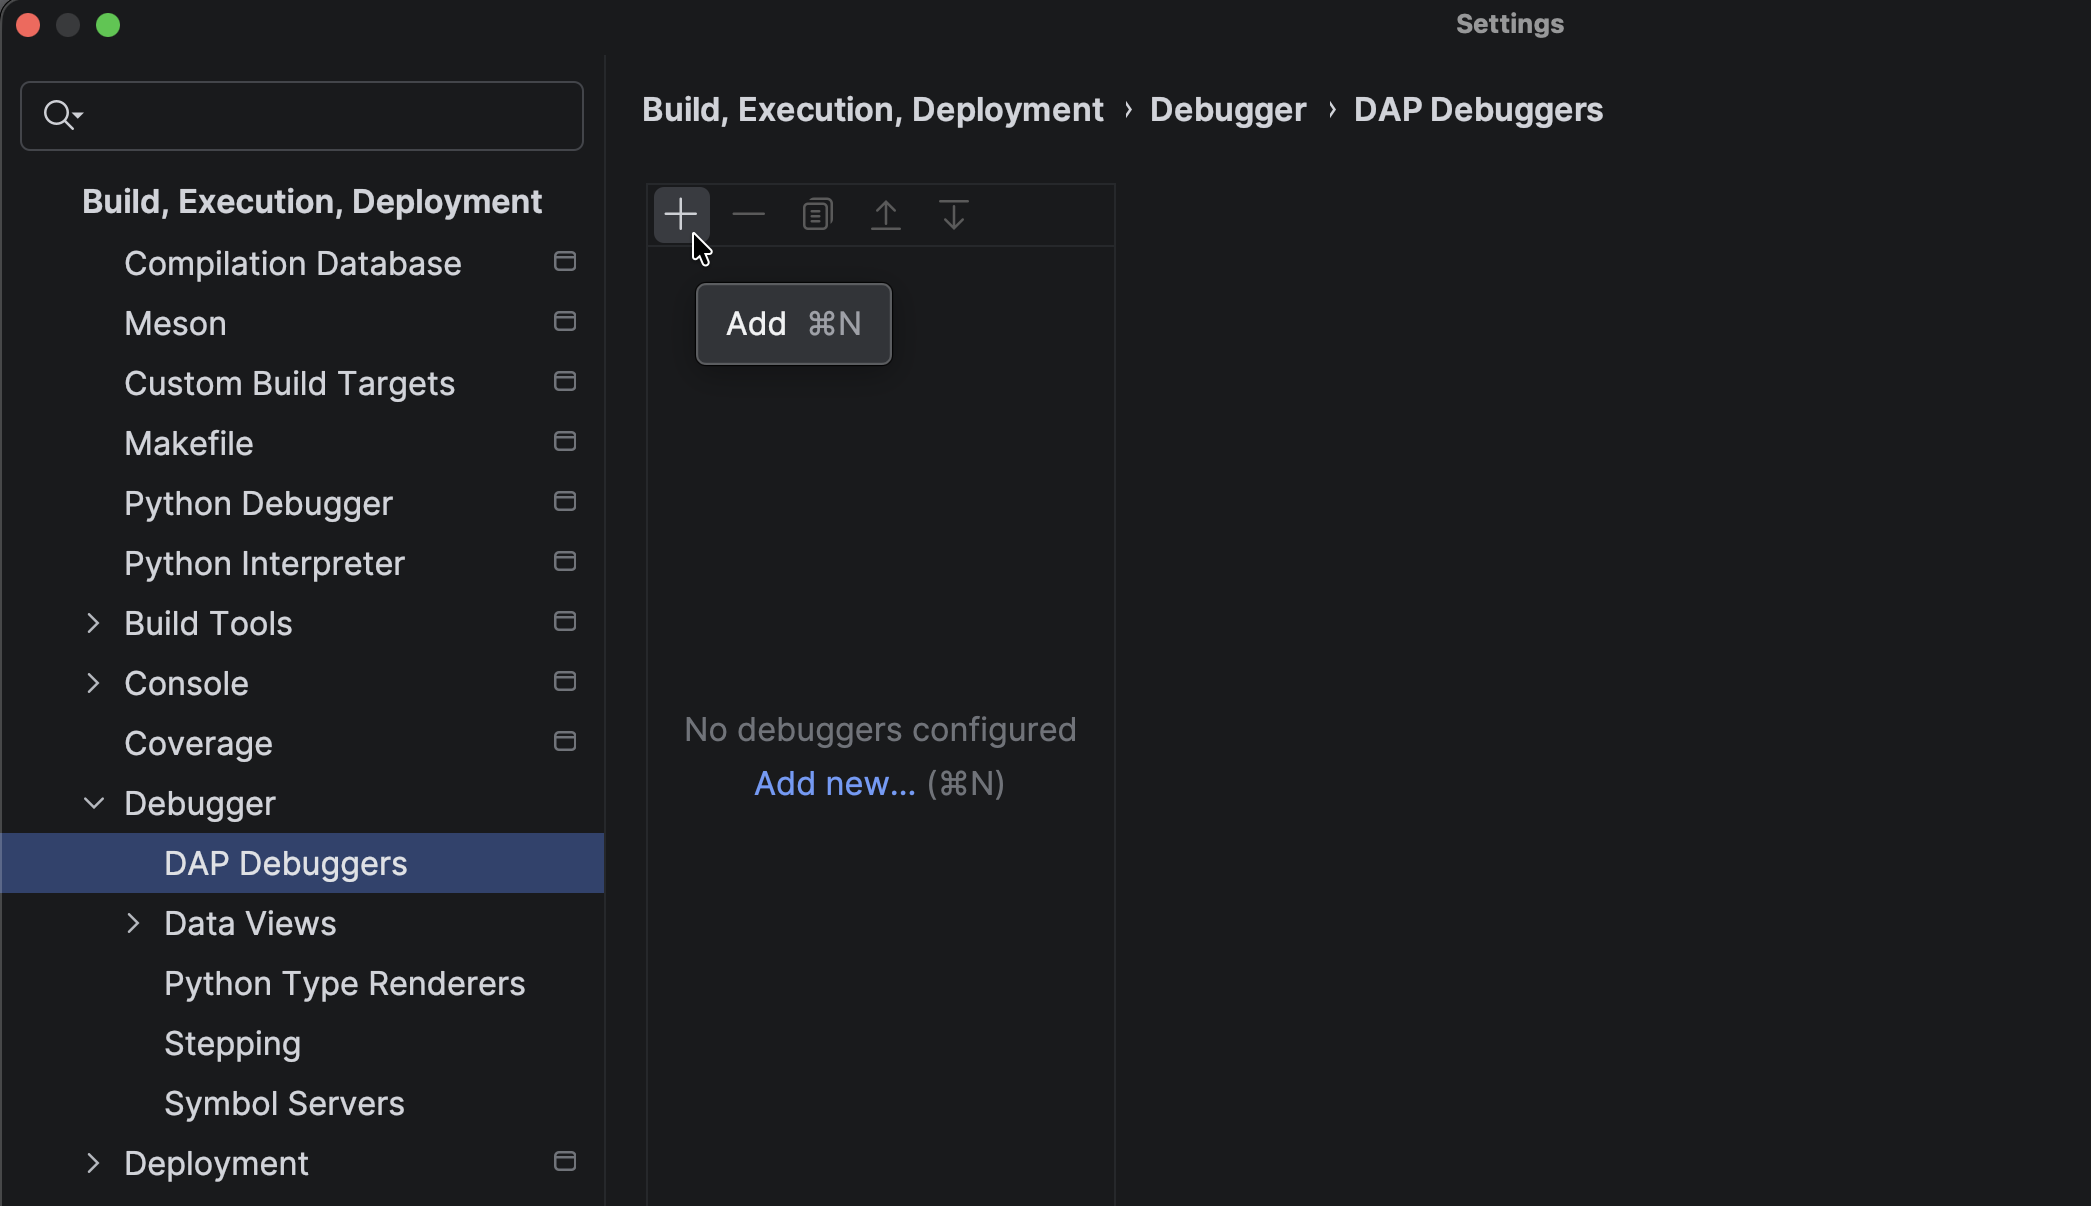
Open the CLion settings, Go to Build, Execution, Deployment > Debugger > DAP Debuggers and then click + to add a new DAP debugger.
Configure the debugger as follows:
Example for Launch parameters:
{
  "trace32Port": 20000, // API port used to communicate with TRACE32.
  "trace32SystemPath": "C:/T32", // Path to the TRACE32 installation.
  "trace32Target": "t32marm", // Name of the TRACE32 executable to launch.
  "screen": false, // Optional. If set to false, TRACE32 PowerView runs in the background.
  "trace32ConnectionScript": "C:/T32/ConnectionScript.cmm", // Script used to configure and launch TRACE32.
  "trace32SetupScript": "D:/clion/trace32Sample/trace32Sample/dap.cmm", // Script that connects to the target CPU and loads the application.
  "trace32SetupScriptTimeout": 10, // Optional. Timeout in seconds to wait for the setup script to complete.
  "trace32SetupScriptArgs": [
    "arg1",
    "arg2"
  ] // Optional. Arguments passed to the setup script.
}
These parameters allow the Debug Adapter to launch TRACE32 and initialize the debugging session automatically.
Example for Attach parameters:
{
  "{
  "trace32Port": 20000, // Optional. API port used to communicate with TRACE32. Defaults to 20000 if not specified.
  "trace32SetupScript": "D:/clion/trace32Sample/trace32Sample/dap.cmm", // Optional. Script executed after TRACE32 is launched. Typically used to connect to the target CPU and load the application.
  "trace32SetupScriptTimeout": 10, // Optional. Timeout, in seconds, to wait for the setup script to complete.
  "trace32SetupScriptArgs": [
    "arg1",
    "arg2"
  ] // Optional. Arguments passed to the setup script.
}
These parameters allow the Debug Adapter to connect to a running TRACE32 PowerView and, optionally, initialize the debugging session using the trace32SetupScript.
Click Apply then OK.
Step 2 – Configure the Toolchain
Go to Settings > Build, Execution, Deployment > Toolchains and select your toolchain.
Select the TRACE32 debugger created in the previous step from the Debugger drop-down list and click OK.
Step 3 – Create a Debug Configuration
Open Run → Edit Configurations....
Click + and select the appropriate configuration type for your project (for example, CMake Application for CMake-based projects).
Configure the following settings:
Name – A descriptive name for the configuration.
Executable/Target – Select the executable to debug.
Save the configuration.
Step 4 – Start a Debug Session
Click Debug in CLion.
The following sequence is performed automatically:
CLion starts the TRACE32 Debug Adapter.
The Debug Adapter launches TRACE32 PowerView.
TRACE32 PowerView executes the connection script.
TRACE32 PowerView executes the startup script.
The application is loaded.
Control is returned to CLion.
You can now debug your application directly from the IDE.
Ending the Debug Session
When debugging is complete:
Click Stop in CLion.
The Debug Adapter terminates the DAP session.
TRACE32 PowerView is closed or disconnected, depending on the adapter configuration.
Troubleshooting
TRACE32 does not start
Verify that:
t32debugadapter.exeexists.The executable path is correct.
The TRACE32 installation directory is valid.
TRACE32 cannot connect to the target
Verify that:
The connection script is correct.
The target hardware is powered.
TRACE32 can connect successfully when started manually.
The application is not loaded
Verify that:
The ELF file exists.
The startup script loads the correct ELF file.
Add a comment