

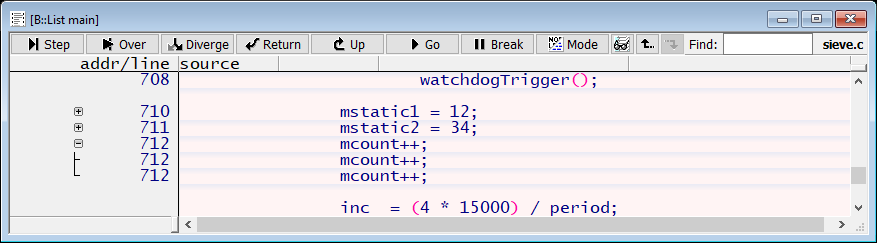
When stepping through optimized code, TRACE32 sometimes seems not to execute the step correctly, the program counter (PC) remains at the same source code line for multiple steps or is jumping back and forth in an unexpected order. The List window usually shows a drill-down box (a + sign) next to some line numbers.
This is a result of the compiler settings and compiler output. As a workaround, summarize adjacent blocks of assembler code when loading an application, e.g. with
Data.LOAD.Elf my_application.elf /SingleLineAdjacent
Please refer also to the video Debugging Optimized Code in TRACE32
Add a comment