

Many developers are currently working remotely from their home office. This page will give you some tips to help you work faster and better.
Ideally use VNC or remote desktop: Best debug performance is achieved with a fast connection between TRACE32 PowerView and the debug module. This is true if the debug module is connected to the PC running PowerView via USB or via local network (LAN).
Alternatively, it is possible to run TRACE32 PowerView on the home office PC and connect to a debug module in the company network via VPN. In this case, the configuration settings outlined below can be used to reduce the communication between TRACE32 PowerView and the debug module and to improve the debug experience.
Reduce the VPN communication
To react quickly and to always display the latest information, the TRACE32 software constantly communicates with the debug hardware and the target. If you work via VPN or Internet, it is recommended to reduce this communication. Here are some recommendations.
SETUP.UpdateRATE
The information of the visible windows is updated 10 times/s by default. This update is done for all windows if the program execution is stopped and for all windows with run-time memory access enabled while the program execution is running (windows with a solid header). TRACE32 also polls the running/stopped status of the target at the same rate.
Our recommendations
- Close all windows that are not required for your current work.
- Lower the update rate e.g. SETUP.UpdateRATE 1.s.
Note
- This setting will cause delayed window updates when debugging locally or through VNC/remote desktop
MAP.UpdateOnce
TRACE32 windows that display unchangeable memory contents do not have to be constantly updated, e.g. a List window that displays object code that is located in the flash. The command MAP.UpdateOnce can be used to reduce the updating of such windows. Updating is only performed once when the program execution stops or when the window is opened.
Our recommendation
- Apply the command MAP.UpdateOnce to all address ranges that do not change.
Data.LOAD /PlusVM
TRACE32 needs to read the object code from the target memory in order to decode the trace raw data for display and analysis. For static programs, this can be avoided by loading a copy of the object code into the TRACE32 Virtual memory (VM). This is ensured by the /PlusVM option.
Our recommendations
- Copy your object code to the TRACE32 Virtual Memory if you have a static application.
Please make sure that the content of the VM is always up-to-date…
- AURIX TriCore: If your TRACE32 tool/target provides trace capability, disable MCDS and trace when you do not need it
(Commands: MCDS.OFF, Trace.DISable).
SYStem.LOG.List
This window can display a log of all types of target accesses made by TRACE32. By default, memory accesses are logged. The SYS.LOG.state window can be used to configure the logging.
Our recommendation
- Use the SYStem.LOG.List window to validate the success of any previously mentioned measure.
The system response times will increase for event driven PRACTICE scripts. These are scripts which use GLOBALON/ON to respond to events such as PBREAK, GO, SYSUP, etc. For possible alternatives please contact our support.
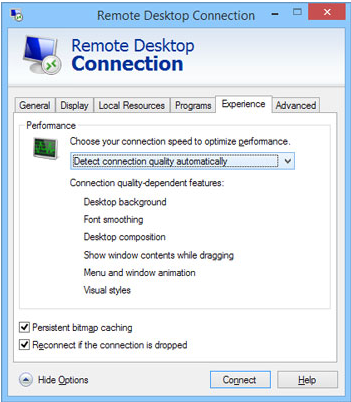
Remote Desktop Connection Experience
It is recommended to leave the Experience at "Detect connection quality automatically" or to set it to "WAN". If the Remote Desktop Connection Experience is limited otherwise, problems can occur if many windows are opened in TRACE32.
Use debugger connected via USB on another development computer
What do I have to do if I need the debugger that is connected to the development host computer of a colleague?
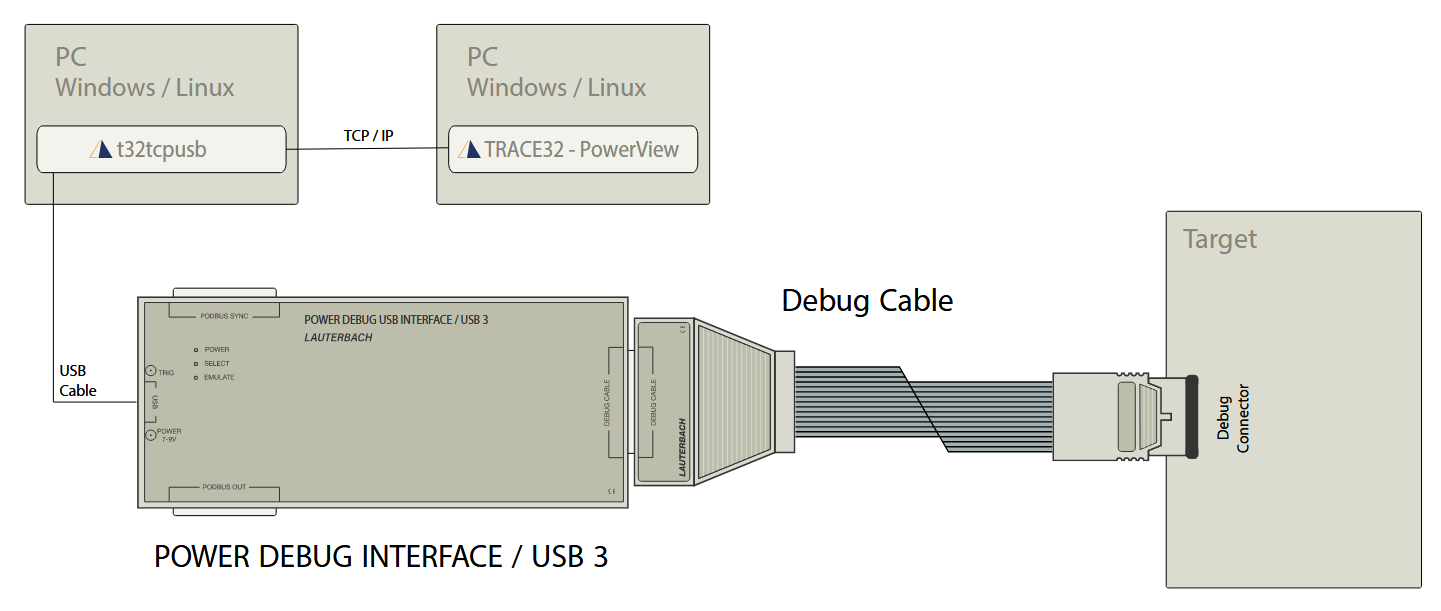
First you have to ask your colleague to start the command line tool t32tcpusb.exe. You can find the exe in the bin directory of your TRACE32 installation. t32tcpusb.exe uses port number 8455 if you do not specify a port number. If you want to use another port number just specify it, for example t32tcpusb.exe 8866.
If your colleague has connected several debuggers via USB to his computer, he should use the TRACE32 command IFCONFIG to assign a to each POWER DEBUG MODULE.
Now you have to enter the device name of the debugger, the IP address of your colleagues computer and the used port number in t32start.exe on your computer (see screenshot).
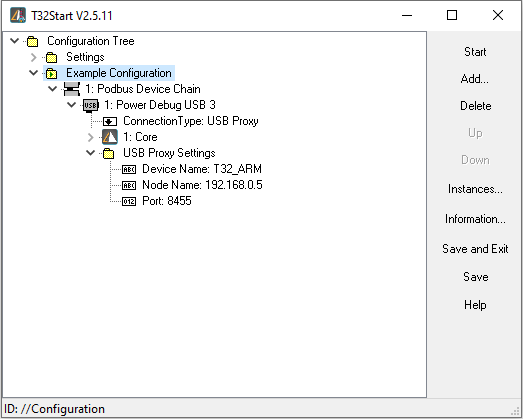
Or update the TRACE32 configuration file on your computer as follows:
PBI=
USB
NODE=
PROXYNAME=
PROXYPORT=
High Capacitive, High-Power Target Power Supply
If your target uses a high capacitive, high-power power supply, we recommend using a high quality IP connector strip with zero cross detection.
Add a comment