

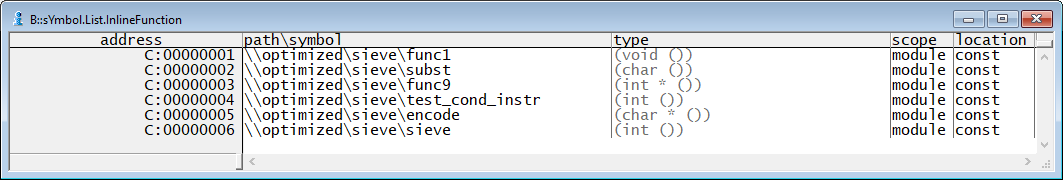
Inline functions are embedded inside the calling functions at each call site. They do not have a unique start address. Inline functions can be displayed in TRACE32 using the command sYmbol.List.InlineFunction
The debugger can display some information about inline functions if the compiler provides information about inlining in the debug information.
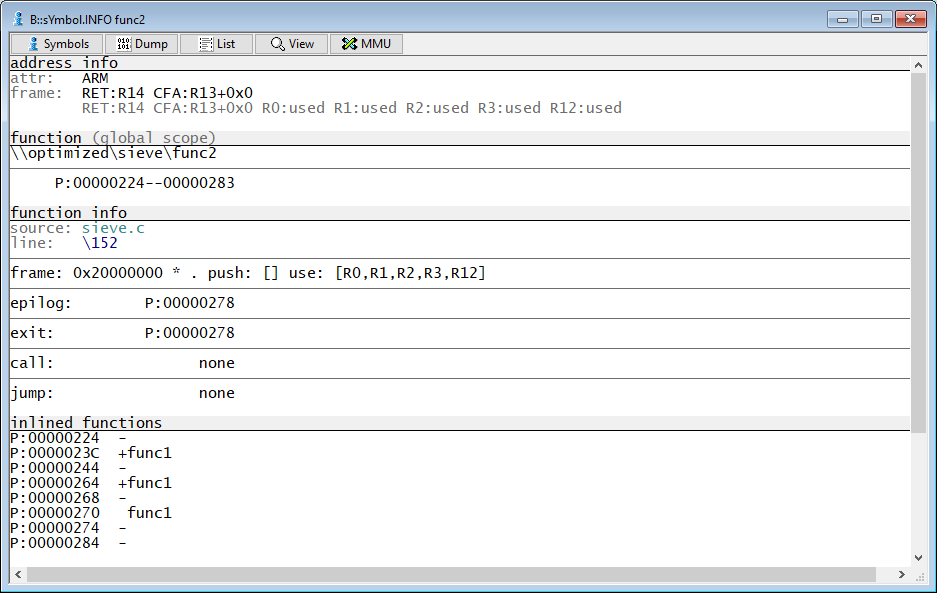
The call sites of inline functions can be displayed in TRACE32 using the sYmbol.INFO command under "inlined functions". The following screenshot shows for instance that the function func1 has been inlined twice inside the function func2:
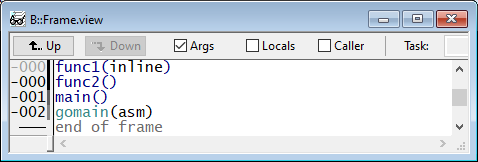
This information is used by the debugger in the function stack frame (Frame.view)
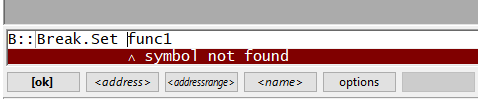
As the function does not have a unique start address, it is however not possible to set a breakpoint at the function start. TRACE32 will show the error message "symbol not found"
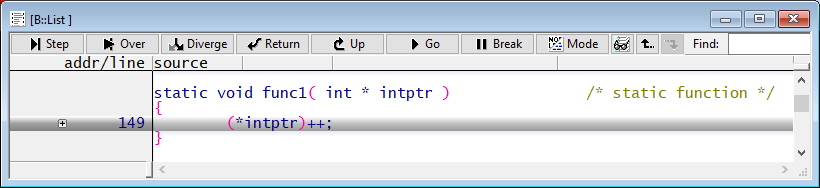
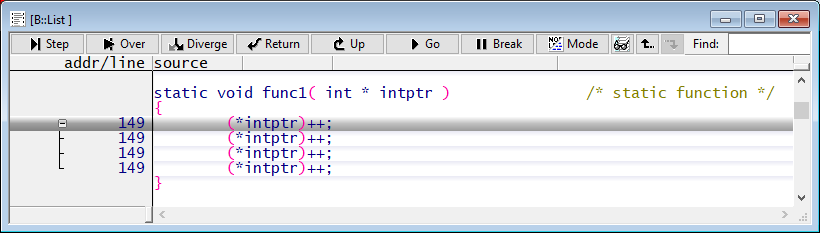
You can however set program breakpoints in single lines of inline function which have been translated into assembly code. If the function is inlined more than once, you will probably see a [+] sign which can be expanded to show the different calling points
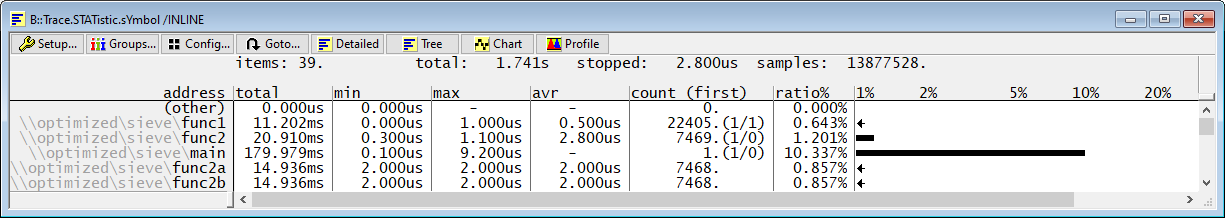
TRACE32 additionally allows displaying runtime information about inline functions based on the trace results using the /INLINE option of the commands Trace.STATistic.sYmbol, Trace.Chart.sYmbol and Trace.PROfileChart.sYmbol. Refer for more information about these commands to https://www.lauterbach.com/pdf/general_ref_t.pdf
Refer for more information about debugging optimized code to the following video: https://support.lauterbach.com/kb/articles/debugging-optimized-code-in-trace32
Add a comment