

The error message "debug port fail" is returned when the TDO response is different from the expected one. Please follow the steps described below. If the error persists, then submit a support ticket and include the results of your diagnosis.
The same diagnosis also applies for the error messages "debug port time-out" and "subcore communication time-out".
Start-up script / CPU selection
Check first if there is a start-up script available for the used chip/board. If yes, use this script. Search also for a script under https://www.lauterbach.com/scripts.html
If you don’t find a start-up script, submit a support ticket to verify if a script is available. If a start-up script exists, read the prerequisites at the start of the script or readme.txt (if available).
Please check also if the used CPU selection is correct. If you do not find a CPU selection for the used chip, check if the processor is supported by TRACE32 using the search on the Lauterbach website or submit a support ticket.
Next things to check
If the "debug port fail" error occurred after a SYStem.Up command, test if SYStem.Mode Attach then Break delivers the same error.
SYStem.Mode Attach
Break
If you don't get an error, then the SYStem.Up issue is probably related to reset options.
The target might be in an unrecoverable state. Re-power the target and retry.
In SMP setups, test if the connection works after assigning only the first core (CORE.ASSIGN 1).
CORE.ASSIGN 1 SYStem.UpNoteFor some chips, the first core is not the boot core. This is especially valid for big.LITTLE systems. Try to connect using the second core (CORE.ASSIGN 2). If connection is possible with the used core, then the other cores have to be activated by the target code.
Try to connect with a low JTAG frequency (e.g. test with SYStem.JtagClock 100Khz) then optimize the JTAG clock if connection with low frequency is possible.
SYStem.JtagClock 100Khz
SYStem.Up
Check if the correct debug port is selected (JTAG / SWD / cJTAG) using the command SYStem.CONFIG DEBUGPORTTYPE
Detect the Daisy Chain (JTAG/cJTAG only)
Execute SYStem.DETECT DaisyChain in Down mode and check the AREA window.
SYStem.Mode Down
SYStem.DETECT DaisyChain
If the detection fails, please re-power the target and retry with SYStem.Option EnRest OFF.
SYStem.Mode Down
SYStem.Option EnRest OFF
SYStem.DETECT DaisyChain
Success:
If the daisy chain can be correctly detected, then the PRE- / POST-settings are printed in the AREA window:
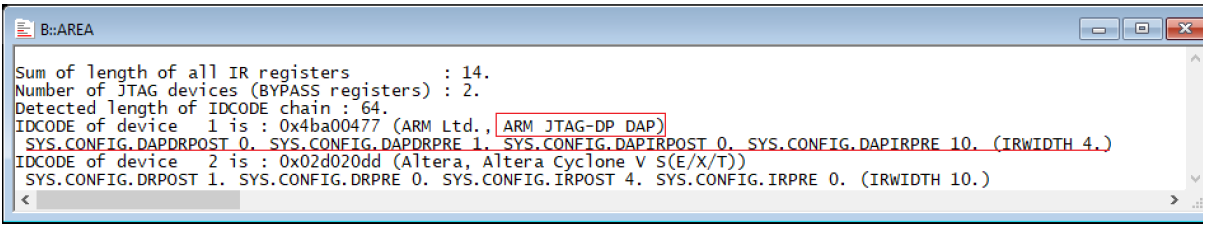
The detection should discover here a device called "ARM JTAG-DP DAP".
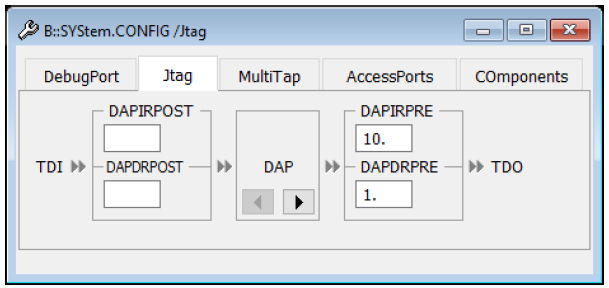
Check in this case if the DAP PRE- and POST-settings under SYStem.CONFIG /JTAG are correct:
Failure
In case the daisy chain cannot be detected, then an error is returned and/or the message “TDO stays constantly LOW/HIGH” is printed to the AREA window:
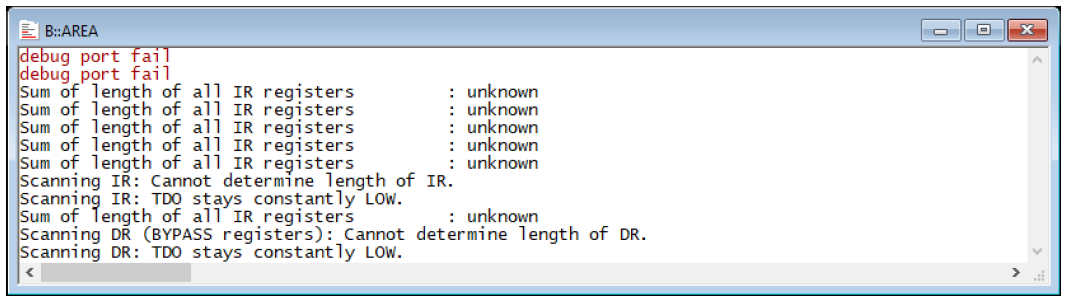
If the DAP PRE- and POST-settings are correct and the problem persists, go to "Try to access the DAP".
Check list:
Are the jumper/switch settings correct? Check the target schematics and documentation
Verify the physical connection by checking the target schematics: are the debug signals correctly connected to the debug header?
Verify the signal levels.
nTRST should not be connected to GND. If the signal is pulled down, it must be ensured that the debugger has a connection to TRST and can pull it up. Especially with connectors that allow two connections: nTRST and nTRST pulldown (MIPI20D, MIPI34, MIPI60), it is possible, if adapters are used, that only one (the wrong) signal is connected.
Serial resistors for TMS/TDI/TCK should be avoided. A 22 or 47 Ohm serial resistor (only) for TDO is OK.
Verify if JTAG signals are multiplexed. Check in this case if the correct mode is selected.
Verify if the correct target power supply is used
check the voltage properties of the power supply and the target
cross-check with a different power supply. The used target power supply might be defective.
Check if there is a watchdog that needs to be deactivated (refer to chip/target documentation).
If nothing of these helps, make a scope plot of the signals TDI/TDO/TMS/TCK when doing a SYStem.Up / SYStem.Mode Attach.
If you don’t see any activity on one of these signals, then you need to check the target schematics.
Signal reflections, e.g. caused by stubs, could cause a wrong detection (multi-clocks) of the TCK signal on the chip side.
Try to access the DAP
Continue with this step only if the JTAG detection is successful.
Set the correct CPU selection
Execute the script access_dap.cmx with the following command:
DODECRYPT "debug_port_fail" access_dap.cmxCheck the AREA window (menu View > Message Area)
If accessing the DAP is successful, continue with "Try to access the core base".
Try to access the core debug base
Continue with this step only if the JTAG detection is successful and the DAP can be successfully accessed.
Re-power the target and execute the following commands in a script:
SYStem.Down
SYStem.Option.EnReset OFF
SYStem.Mode Prepare
IF ADDRESS.OFFSET(COREBASE())!=0
(
  PRIVATE &lsr
  IF (Data.Long(COREBASE()+0xFB4)&0x3)==0x3
    Data.Set (COREBASE()+0xFB0) %Long 0xC5ACCE55
  Data.dump (COREBASE()+0xF00)++0xFF
)
ELSE
  PRINT %ERROR "It seems the core base is not configured, see SYStem.CONFIG.COREDEBUG.Base"
Success:
Data.dump window displays data
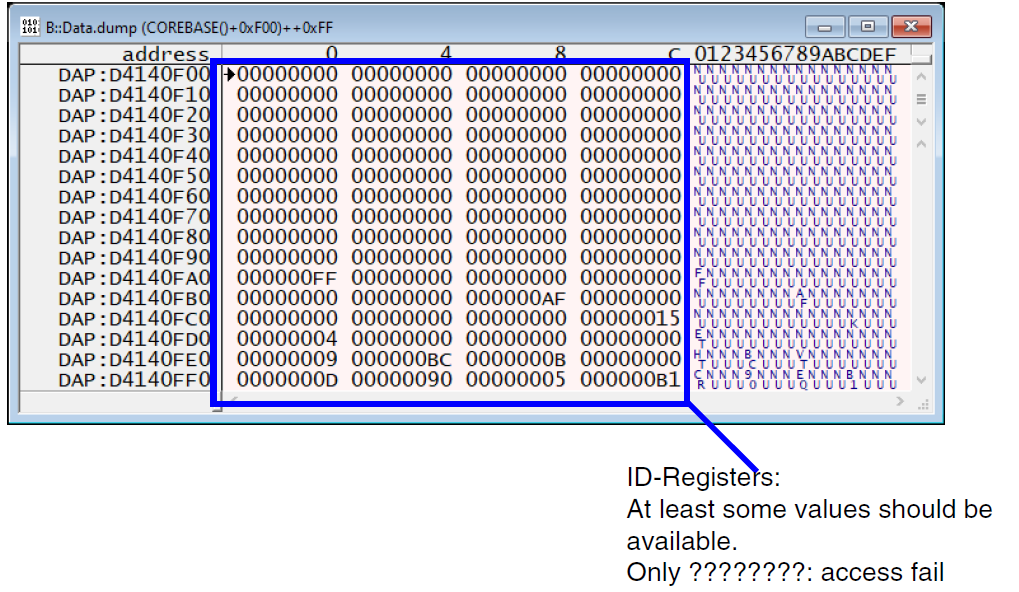
Failure:
Error returned or Data.dump window displays ???????
Check list:
Core might be kept in reset, has no power, no clock, or is secured.
Core might be in power saving (sleep) mode.
A watchdog might be enabled and accessing the target after booting is not possible. Check the target documentation.
If the CoreSight settings are done in a script using the SYStem.CONFIG commands, then the core base address might be wrong. Check processor documentation if available.
Comments (2)