

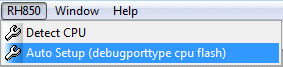
"debug port fail" Error in Debugging Mode
If you get a “debug port fail” error message after a a SYStem.Up or SYStem.Mode Attach, then please first try to use the AutoSetup dialog to connect to the target by selecting the menu RH850 > Auto Setup in the TRACE32 PowerView user interface of by calling the script ~~/demo/rh850/flash/rh850_autosetup.cmm available in the TRACE32 demo directory:
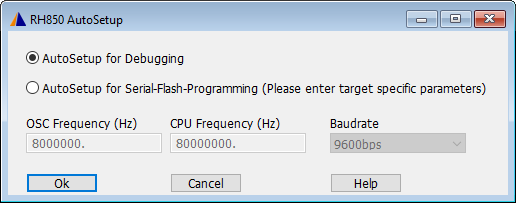
DO ~~/demo/rh850/flash/rh850_autosetup.cmmThe script opens the following dialog:
If you still get the “debug port fail” error, then please check the following:
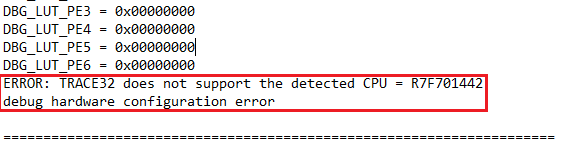
Your TRACE32 version might be too old. It is recommended to use the latest TRACE32 release available for download on the Lauterbach website. In such cases, you would get a message indicating this in the AREA window:
The used JTAG clock might be too high (JTAG mode only). Try a lower JTAG clock using the command SYStem.JtagClock e.g. SYStem.JtagClock 1MHz
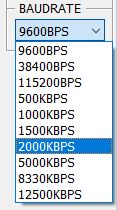
If you are using LPD mode, then try different baud rate values using the command SYStem.BAUDRATE or using the BAUDRATE pulldown menu in the SYStem window
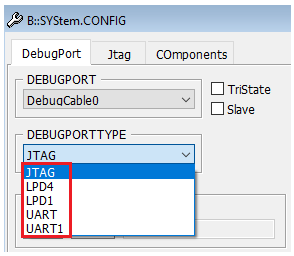
For the G3-core variants, the selected debug port type (JTAG / LPD4 / LPD1) might not match the Option Bytes. Please try different debug port types using the command SYStem.CONFIG DEBUGPORTTYPE
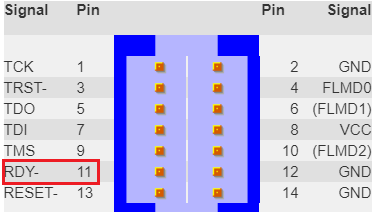
If the RDY-line is not connected then you should use SYStem.Option.RDYLINE OFF. The RDY-line is a CPU output signal located on pin 11 of the debug connector. This signal informs the debugger when a CPU can accept the next JTAG command. TRACE32 assumes per default that the RDY-line is connected. If SYStem.Option.RDYLINE is set to OFF then TRACE32 will get the “ready-status” by polling the CPU debug registers. Disabling the RDY- line has no impact the on debug functionality, but causes loss of performance in the JTAG communication.
The problem could be caused by a bad quality of the debug signals e.g. reflections on TCK line. Please check the debug signals, especially TCK with a scope. A serial termination at TCK (e.g. 50..100Ohm) between target and debugger may solve the problem in such cases. Check moreover if the FLMD0 signal is correctly connected. Board designer should locate the debug connector as close as possible to the processor to minimize the capacitive influence of the trace length and cross coupling of noise into the debug signals.
The RESET signal of the CPU might be not properly connected. Check the voltage level with an oscilloscope. The RESET signal should toggle at SYStem.Up. Check additionally if the CPU is permanently in reset.
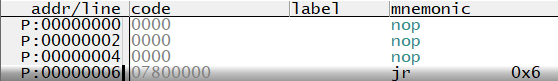
The problem may be caused in some cases by the target application: when a debug tool tries to connect to the CPU, the application code is already running (not for G4-core variants). Application code may disturb the debug-connection process. A workaround is to patch a jump to the same address at the reset vector. Refer for more information to the RH850 Debugger and Trace manual under Useful Tips > Application Starts Running at SYStem.Up.
Debug interface might be locked. Please refer to the description of the following three commands in the RH850 Debugger and Trace manual for more information:
SYStem.Option OCDID < value > ; unlocks the debug access
SYStem.Option CFID < value >; unlocks the code flash access
SYStem.Option DFID < value >; unlocks the data flash access
ID-Code-Protection Unit might be locked (G3K-core variants only). You can use in this case the command
SYStem.Option KEYCODE < value >
"debug port fail" Error in Serial-Flash-Programming Mode
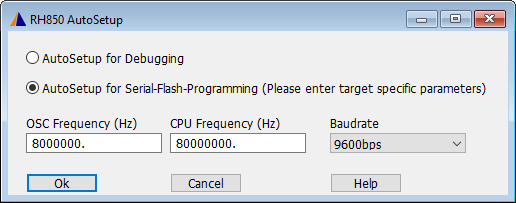
First try to use the AutoSetup dialog by selecting the menu RH850 > Auto Setup in the TRACE32 PowerView user interface of by calling the script ~~/demo/rh850/flash/rh850_autosetup.cmm available in the TRACE32 demo directory:
DO ~~/demo/rh850/flash/rh850_autosetup.cmmThe script opens the following dialog, select “AutoSetup forSerial-Flash-Programming” and press OK:
If you still get an error, the try the following:
Check the BAUDRATE: try different values
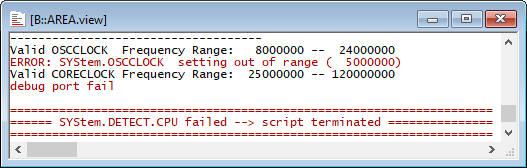
OSCCLOCK and CORECLOCK have to match the target oscillator frequency and CPU Core-Clock. AREA window gives an indication about valid values
Check if the FLMD0 signal is correctly connected
If the issue persists
Open a new ticket from https://support.lauterbach.com/new-ticket or email support@lauterbach.com and include the following information:
Detailed description of the issue
Screenshots that show the issue
Which CPU and target are used?
Generate a system information report about your TRACE32 configuration by selecting the TRACE32 menu 'Help' > 'Support' > 'System Information...', click 'Save to File'
The content of the AREA window
Add a comment