

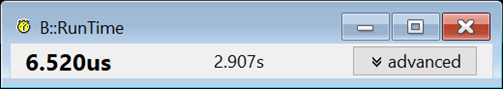
What is the runtime of my function? What effect did my last code change have on the runtime behavior? Many developers ask themselves similar questions while debugging. To provide a quick and precise answer, Lauterbach has redesigned its RunTime Window. The runtime is now displayed there directly when the program execution stops. This applies to single core and SMP systems.
How does this work? Many cores contain onchip benchmark counters that can be configured to measure clock cycles during program execution. Knowing the clock frequency, the program runtime can be calculated. For this functionality to work, the following requirements must be met:
The clock frequency must remain constant over the entire program runtime.
The benchmark counter must start counting the cycles exactly when the program execution is started.
The benchmark counter must stop counting the cycles exactly when the program execution is stopped.
Just a few configuration steps, which are ideally performed in the start-up script, are needed to make this precise instrument available.
For most cores, the following two commands are enough.
// Inform TRACE32 RunTime system about the clock frequency.
RunTime.CLOCK 400.MHZ

// Advise TRACE32 to configure a free benchmark counter as clock cycle counter.
// Configure the RunTime Window to use this benchmark counter for its runtime measurements.
RunTime.Mode BMC
Currently, this already works for the Renesas RH850 and Arm® Cortex®-M/R/A/X.
Some core architectures require slightly different commands.
Infineon AURIX™ TriCore™ TC2xx und TC3xx
// Enable clock frequency calculation.
CLOCK.ON

// Advise TRACE32 to configure a free benchmark counter as clock cycle counter.
// Configure the RunTime Window to use this benchmark counter for its runtime measurements.
RunTime.Mode BMC
Tensilica Xtensa
// Not all Xtensa cores have benchmark counters. Therefore, the availability must be checked first.
// Configure PM0 as cycle counter.
BMC.PM0.EVENT CYCLE

// Set PM0 compare operator
BMC.PM0.KRNLCNT LessEqual

// Set PM0 counting threshold
BMC.PM0.TraceLevel 5.

// Inform TRACE32 RunTime system about the clock frequency.
RunTime.CLOCK 80.MHz

// Configure the RunTime Window to use PM0 for runtime measurements.
RunTime.Mode BMC
Supported core architectures:
Renesas RH850: Build 163851 or TRACE32 Release 2023/09
Arm® Cortex®-M/R/A/X, AURIX™ TriCore™ TC2xx und TC3xx, Tensilica Xtensa: Build 164216 or TRACE32 Release 2024/02
more to follow.
Add a comment